Observability
Boot a bounded, agent-managed Grafana + Prometheus + node-exporter stack on your box — an observer seat deploys it, watches it, and explains in plain English how the box is doing, honest about every unknown and failure.
What you get
One folder. Copy it in, hand it to your agent.
apps/observability
├── README.md
├── app
│   └── observability.html
├── app.json
└── assets
Screens
About
Observability
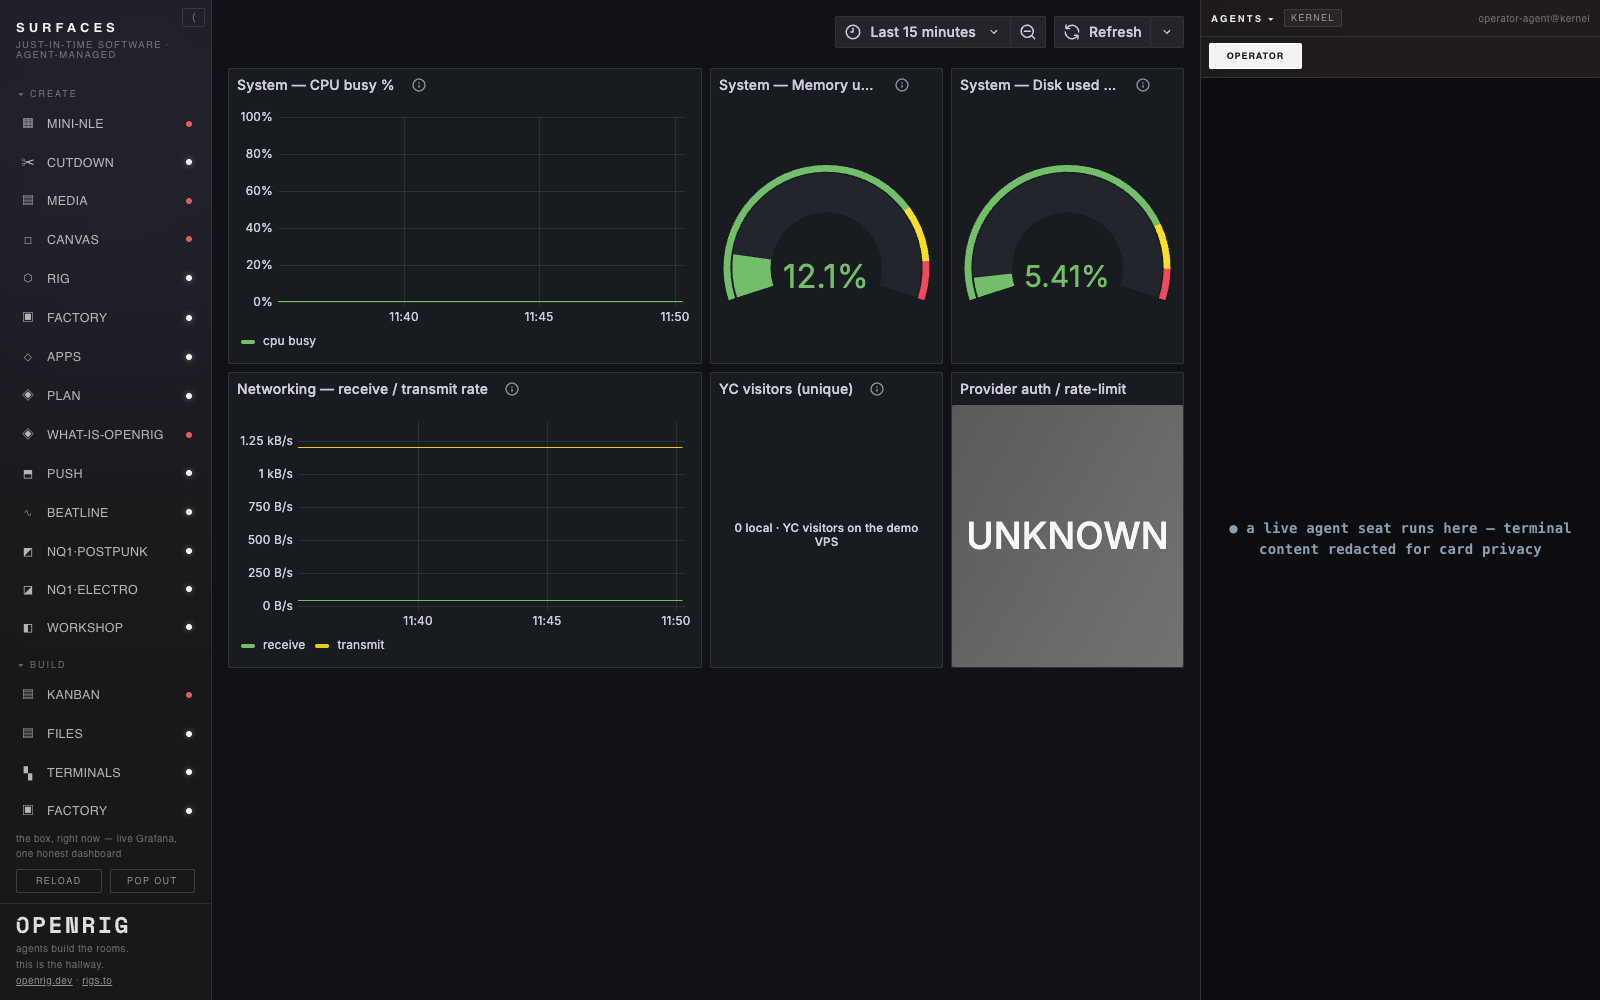
One clean folder that a rig boots into a working, agent-managed observability stack. An infra seat holds a bounded Grafana + Prometheus + node-exporter stack; an observer agent seat deploys it, watches it, and explains — in plain English — how the box is doing right now, honest about every unknown and every failure.
What the dashboard shows
Four honest categories, one dark board:
- System — CPU busy, memory used, disk used, from node-exporter reading the real guest /proc, /sys, and rootfs (read-only mounts, unprivileged).
- Networking — receive and transmit rates, from node-exporter.
- Visitor activity — read-only from the box's access-visitors log (one email + first-seen per line); never modified.
- Provider auth / rate-limit — read-only from the provider watcher's durable state. When that source is missing or unavailable the panel reads UNKNOWN — never a fabricated healthy zero.
The three verbs
node obs.mjs deploy      boot only this bounded stack (disposable guest only)
node obs.mjs watch       report current stack + source + metric health
node obs.mjs explain     plain-English "how is the box doing right now?"
Honest data contract
The adapter transforms the read-only JSONL sources into an owned Prometheus textfile (box_visitor_ and box_provider_ metrics) and never modifies the sources. It records source path, source mtime, parse time, and newest-event time. A missing, malformed, or unavailable source is reported as unavailable (source-available 0), and a real provider failure always outranks an incidental unknown.
Install (drift-aware, no destructive action)
The stack runs in your disposable guest only — never on the shared host. Compare the canonical installed source at ~/studio/apps/observability against the box's deployed stack, and repair (copy the canonical source in) only if the box stack is missing, provably broken, or provably older. If the box stack is newer (forward drift), leave it untouched and report. If age or health is ambiguous, leave it untouched and report to the box lead agent.
Verbs
- GET
/api/v1/query— Prometheus instant query of the box_* and system/network metrics (what the observer seat reads) - GET
/api/v1/query_range— Prometheus range query behind the dashboard's time-series panels - GET
/-/healthy— Prometheus liveness — is the metrics stack up - GET
/metrics— node-exporter host metrics (CPU, memory, disk, network) from the guest /proc, /sys, and rootfs
Install requirements
- Installs to
~/studio/apps/observability - Pure static surface (no server)
- The bounded stack boots in the disposable guest (node obs.mjs deploy — docker compose: Grafana + Prometheus + node-exporter, 127.0.0.1-only, digest-pinned) and Grafana serves the one dark box dashboard
- The read-only adapter (box-metrics.mjs) projects the box's visitor + provider JSONL into an owned Prometheus textfile (box_visitor_* / box_provider_*) without modifying the sources, and reports a missing or unavailable source as UNKNOWN (box_*_source_available 0) — never a fabricated healthy zero
- Compare the canonical installed source at ~/studio/apps/observability against the box's deployed stack: repair (copy the canonical source in) ONLY if the box stack is missing, provably broken, or provably older than the canonical source; if the box stack is newer (forward drift) leave it untouched and report; if relative age or health is ambiguous, leave it untouched and report to the box lead agent — take no destructive action
Install with your agent
Paste this into your box's lead agent — it installs the app on your box.
Install request — Observability

App id:        observability
Registry repo: mvschwarz/rigs-to-apps
Manifest path: apps/observability/app.json

Please install this mini-app onto my studio box:
  1. Retrieve observability's app.json from the registry repo (mvschwarz/rigs-to-apps) at apps/observability/app.json,
     then resolve and record its current commit SHA for provenance.
  2. Apply judgment: check for name and port collisions with what's already
     installed, and place it in a sensible sidebar group (category default: system).
  3. Install the app directory to ~/studio/apps/observability.
  4. Register its surfaces door: route /observability.html with the
     ▥ glyph, grouped under the system default group.
  5. No server — this is a pure static surface.
  6. Then verify:
       - The bounded stack boots in the disposable guest (node obs.mjs deploy — docker compose: Grafana + Prometheus + node-exporter, 127.0.0.1-only, digest-pinned) and Grafana serves the one dark box dashboard
       - The read-only adapter (box-metrics.mjs) projects the box's visitor + provider JSONL into an owned Prometheus textfile (box_visitor_* / box_provider_*) without modifying the sources, and reports a missing or unavailable source as UNKNOWN (box_*_source_available 0) — never a fabricated healthy zero
       - Compare the canonical installed source at ~/studio/apps/observability against the box's deployed stack: repair (copy the canonical source in) ONLY if the box stack is missing, provably broken, or provably older than the canonical source; if the box stack is newer (forward drift) leave it untouched and report; if relative age or health is ambiguous, leave it untouched and report to the box lead agent — take no destructive action

Verbs this app exposes (for reference, method omitted):
  /api/v1/query — Prometheus instant query of the box_* and system/network metrics (what the observer seat reads)
  /api/v1/query_range — Prometheus range query behind the dashboard's time-series panels
  /-/healthy — Prometheus liveness — is the metrics stack up
  /metrics — node-exporter host metrics (CPU, memory, disk, network) from the guest /proc, /sys, and rootfs

(You are my trusted box lead agent; act inside the box. Nothing here calls out.)